RiskScape
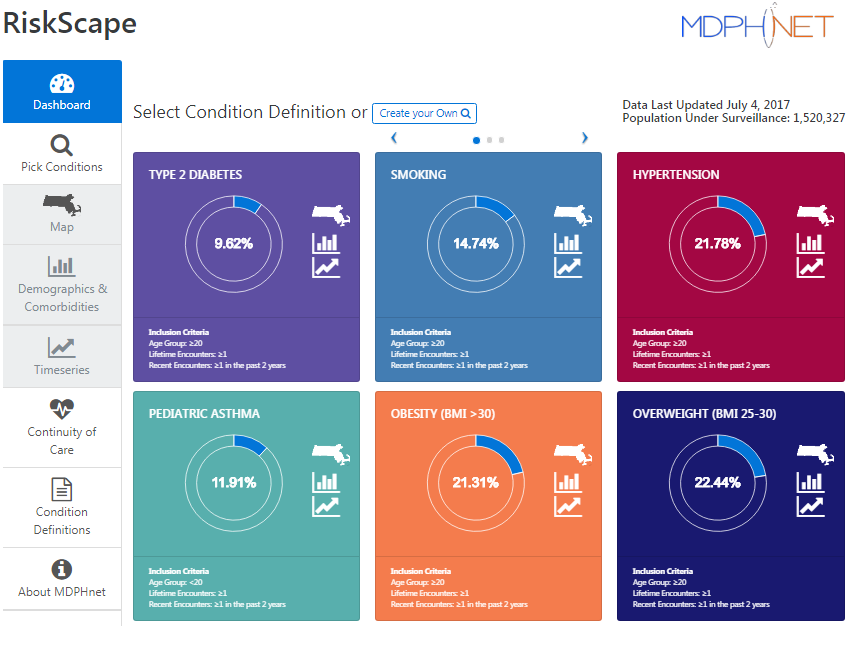
A powerful and easy-to-use web-based data visualization tool that allows users to map diseases or health conditions, explore affected populations, and assess for changes in health conditions over time.
RiskScape is ESP's interactive, web-based data visualization platform. It provides timely, high-level summaries of specific conditions of interest to public health officials.It utilizes data from the same clinical partners as MDPHnet but is built on a centralized, individual-level, deidentified dataset that is updated monthly.
Users can generate graphs based on condition of interest while filtering or stratifying by other factors such as age, sex, race/ethnicity, health indicators, and comorbidities.
RiskScape Image Gallery
Available graphs include
- Heat maps of conditions by zip code
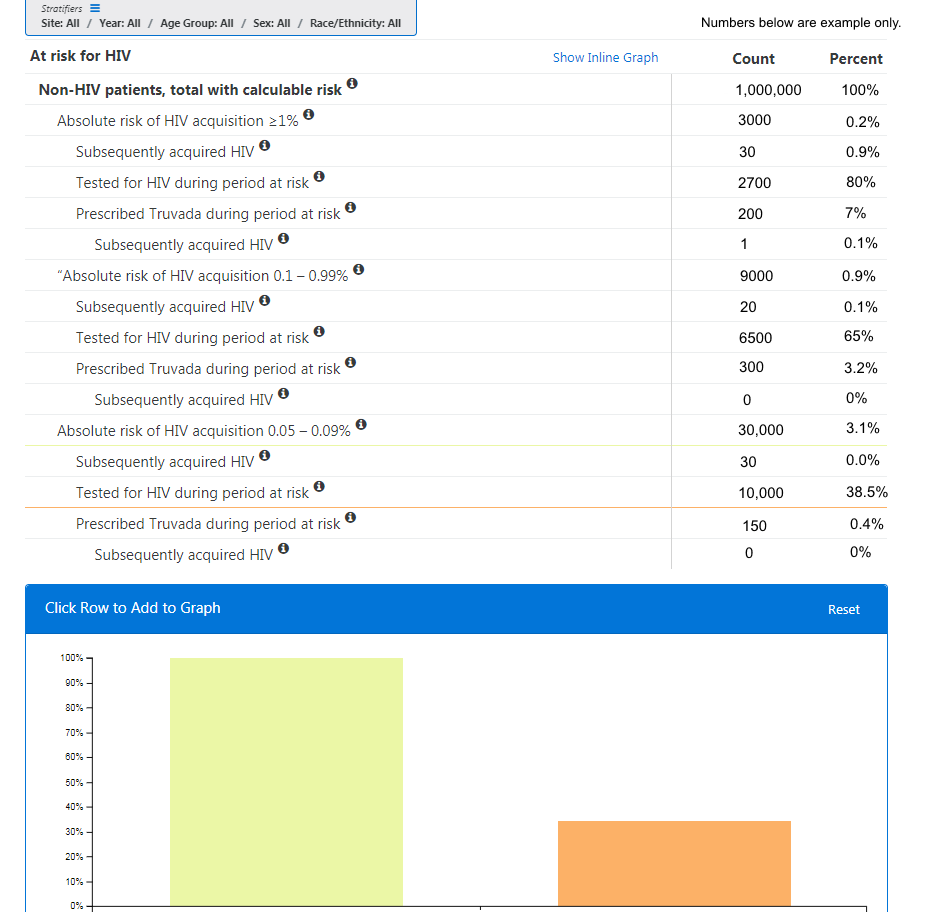
- Bar graphs for prevalences stratified by demographic or comorbidity categories
- Pie charts with demographic characteristics of affected populations
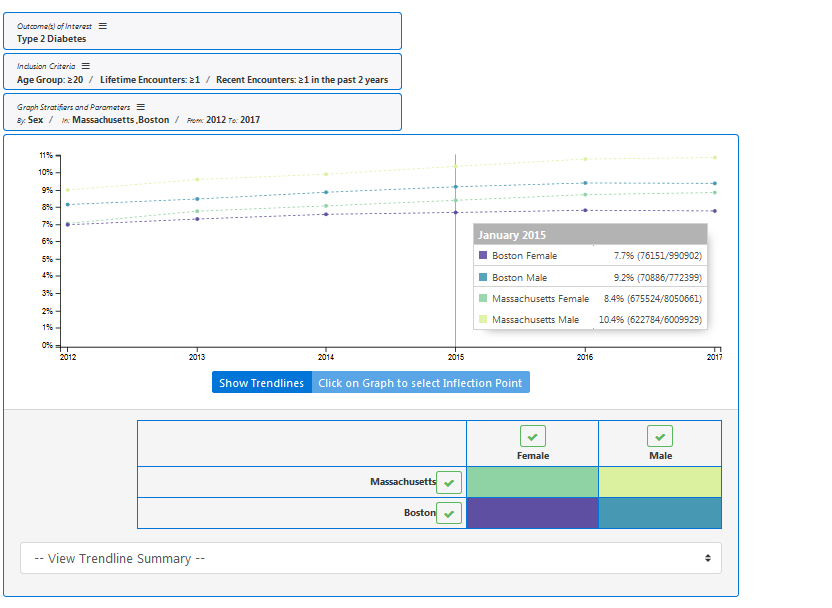
- Time series graphs that permit automated regression analyses
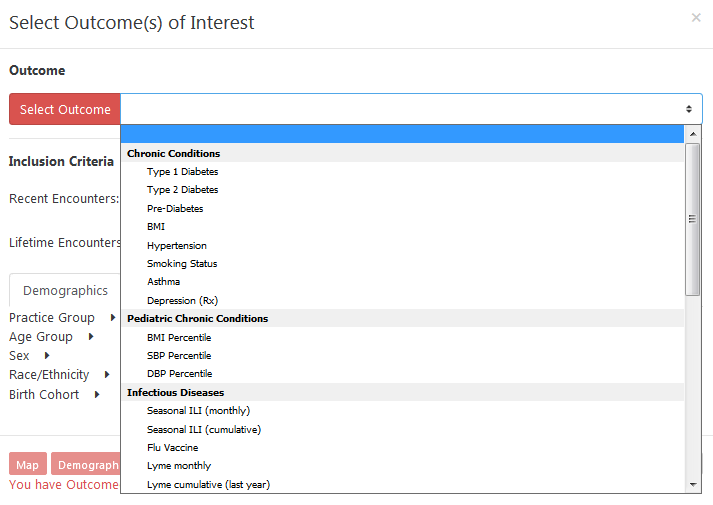
Conditions available for query in RiskScape include
Conditions
- Asthma
- Depression
- Hypertension* and diagnosed hypertension
- Body mass index*
- Pre-diabetes
- Diabetes, Type 1
- Diabetes, Type 2
- Diabetes, Gestational
- Pregnancy status
* with percentiles for pediatric groups
Infectious Diseases
- Chlamydia
- Gonorrhea
- Influenza-like Illness
- Lyme Disease
- Pertussis
- Hepatitis C screening
Controlled Substances
- Opioid prescribing
- High dose opioid prescribing
- Benzodiazepine prescribing
- Concurrent prescriptions for opioids and benzodiazepines
Labs & Meds
- Hemoglobin A1C levels
- LDL cholesterol levels
- Triglyceride levels
- Influenza vaccinations
- Insulin prescribing
- Metformin prescribing
Access to RiskScape is limited to practice sites that contribute data to RiskScape and selected employees of the Massachusetts Department of Public Health.


